Read elevation from Swisstopo api for cross sections
Bas den Brok - mapping course
Understanding of python and maybe some understanding of SVG required.
We want to read the elevations between two given points in Swissgrid CH1903 coordinates
to get the topography for a cross section between these two points. We write resulting elevations
in a text file that can easily be imported in OpenOffice Calc and an svg-file to import the topography in Inkscape as an
SVG polyline that can easily be converted into a path if desired.
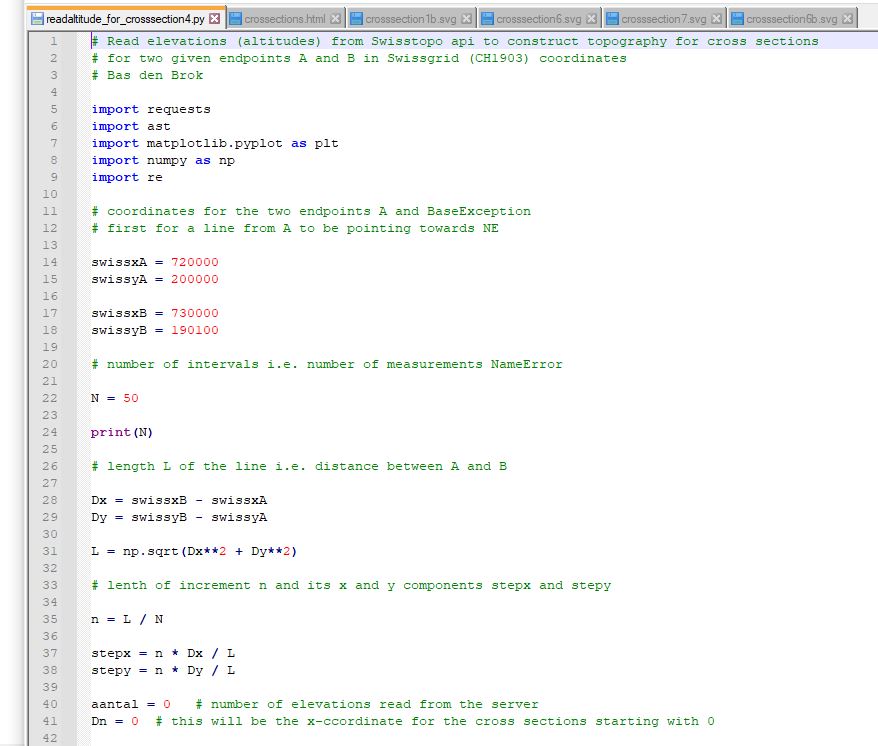
In the below example of the pthon code we have chosen a cross section with
point A (NW left) with Swissgrid coordinates (720000, 200000) and point B (SE right)
with Swissgrid coordinates (730000, 190100) and set the number of intervals N=50. The length of the
cross sections, i.e. distance betwen A and B equals L (in meter) and the distance between the 50 points that
will make up the topography euqals n (in meter).
We open two files to write data to: one text file and one SVG-file.

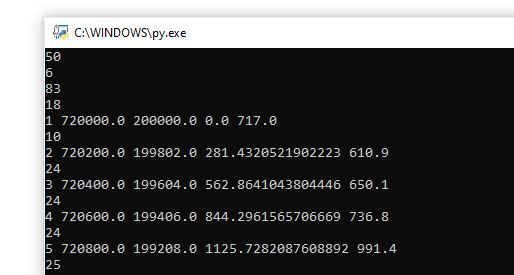
Output on the screen looks like below. The numbers 50, 6, 83, 18, 10, 24 etc. indicate the numbers of characters
written to the SVG-file
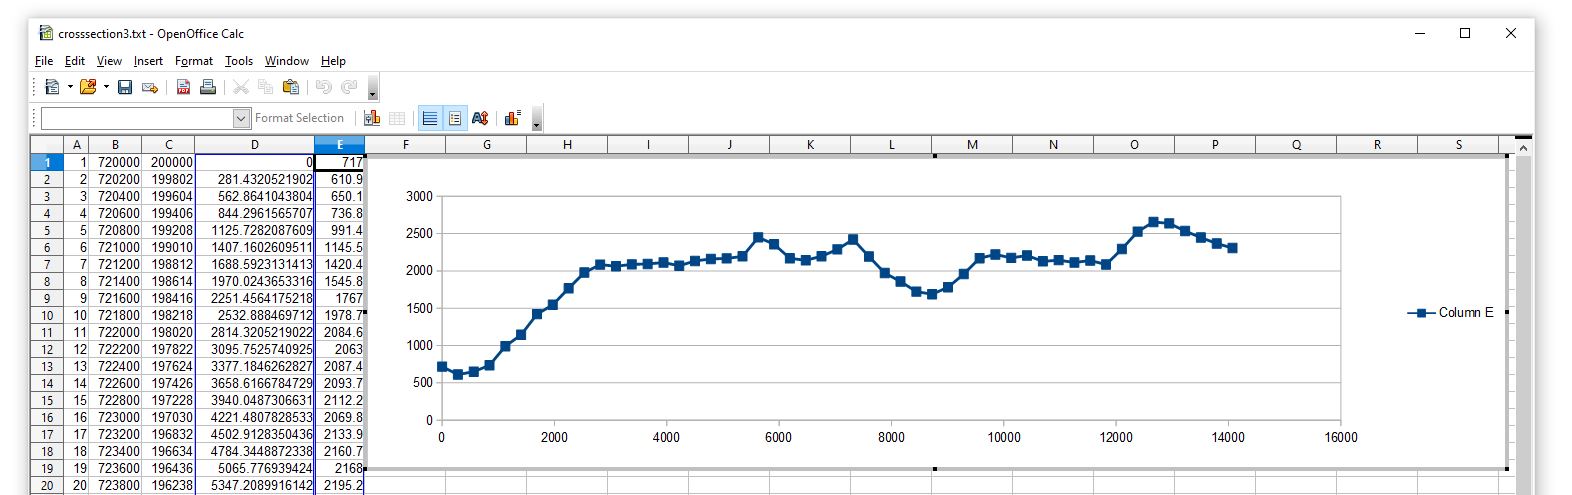
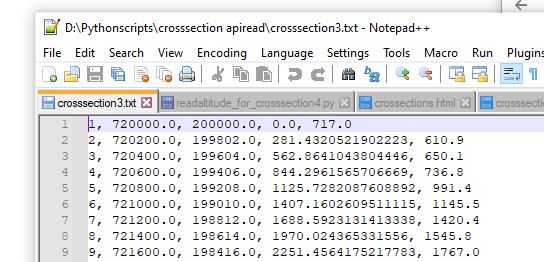
Below is an example of the text file for in OpenOfficeCalc showing
for each point on the topography line the two Swissgrid coordinates,
the distance from point A and the elevation (in meter).
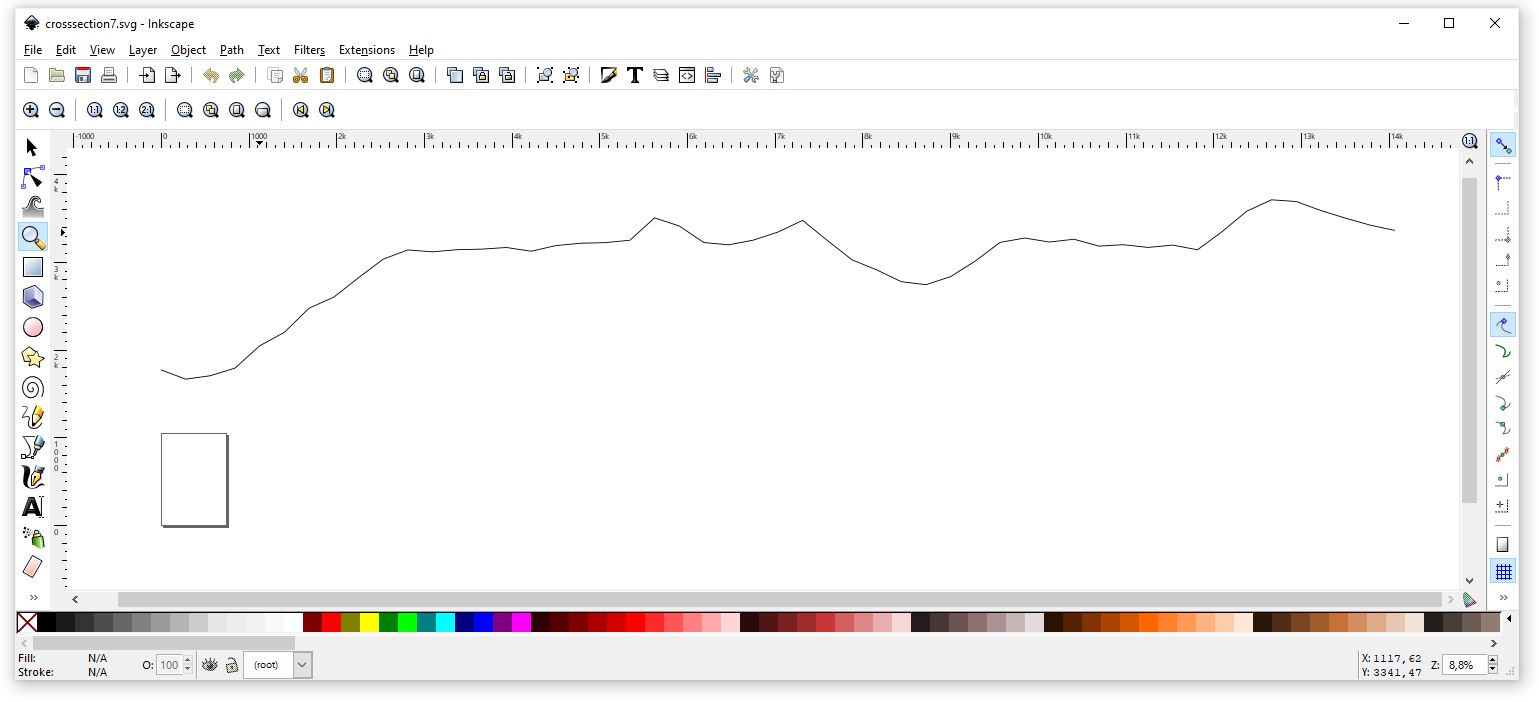
Here below is the code of the SVG-file with the polyline representing the topography between A and B.
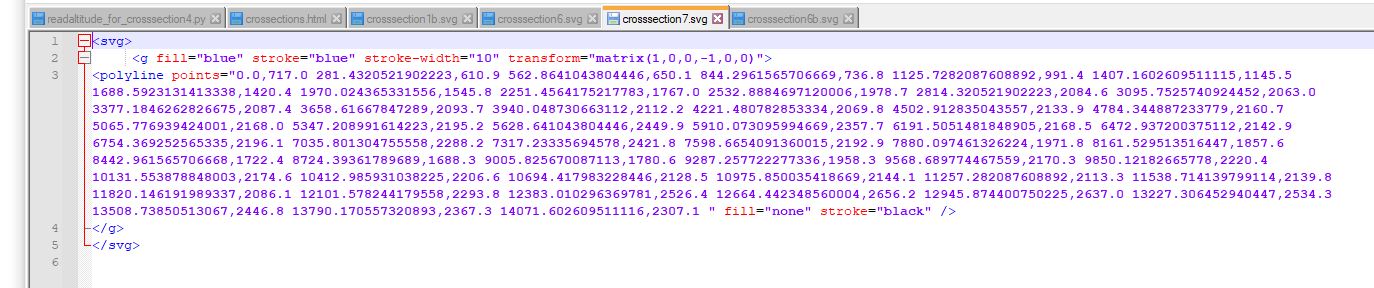
and how it looks in Inkscape.
And finally here below the text file in OpenOfficeCalc.