GPX to SVG
Bas den Brok - mapping course
Reading latitudes and longtitudes from GPX files in python, convert WGS84 values to Swissgrid coordinates CH1903
and write values in an SVG file to plot on a map in SVG-format
Some basic knowledge of German, Dutch, XML, SVG and python required
Maybe first look here:
http://www.denbrok.ch/geology/exchange/gpx/gpx_to_txt.html
Entire python file: read_gpx_write_svg_4.py
Not meant for use but to help write your own file!
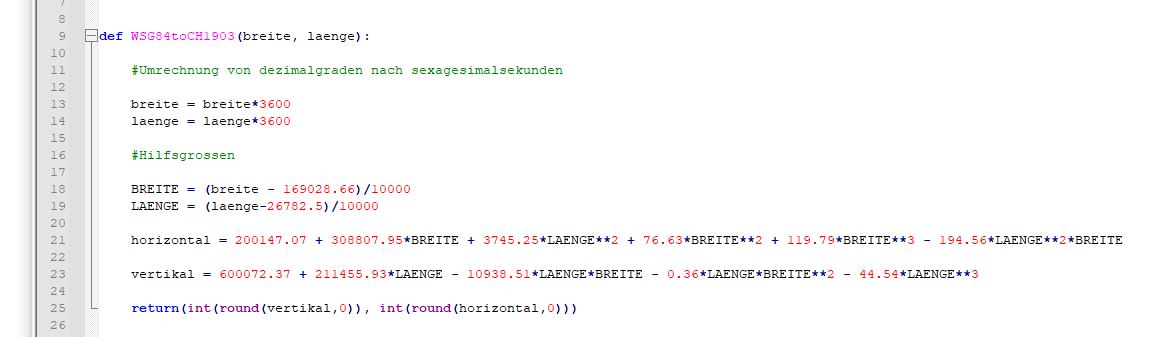
Python function (def) to convert WGS84 values to Swissgrid coordinates CH1903.
See here (PDF "Approximate formulas ..."):
https://www.swisstopo.admin.ch/en/maps-data-online/calculation-services.html
See also:
https://www.giangrandi.org/soft/swissgrid/swissgrid.shtml
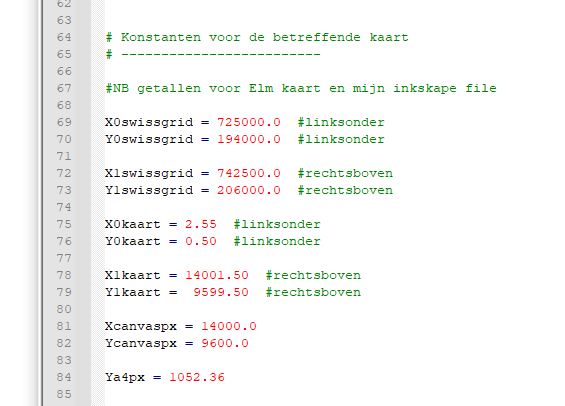
Coordinates of existing map in SVG-format and corresponding CH1903-values needed for
scaling CH1903 coordinates to the specific SVG-map-coordinates. Note that SVG-coordinates (Version 1.1) have 0,0 in
upper left corner (positive X to the right and positive Y going down).
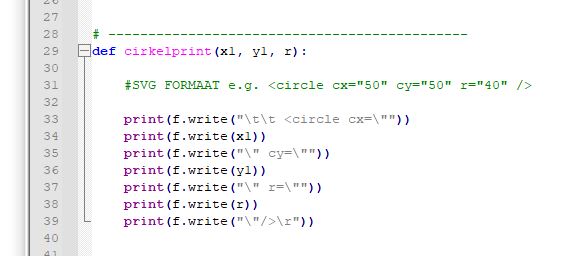
Pyton function (def) to write SVG. Plots a dot with radius r at SVG-coordinates x1 and y1.
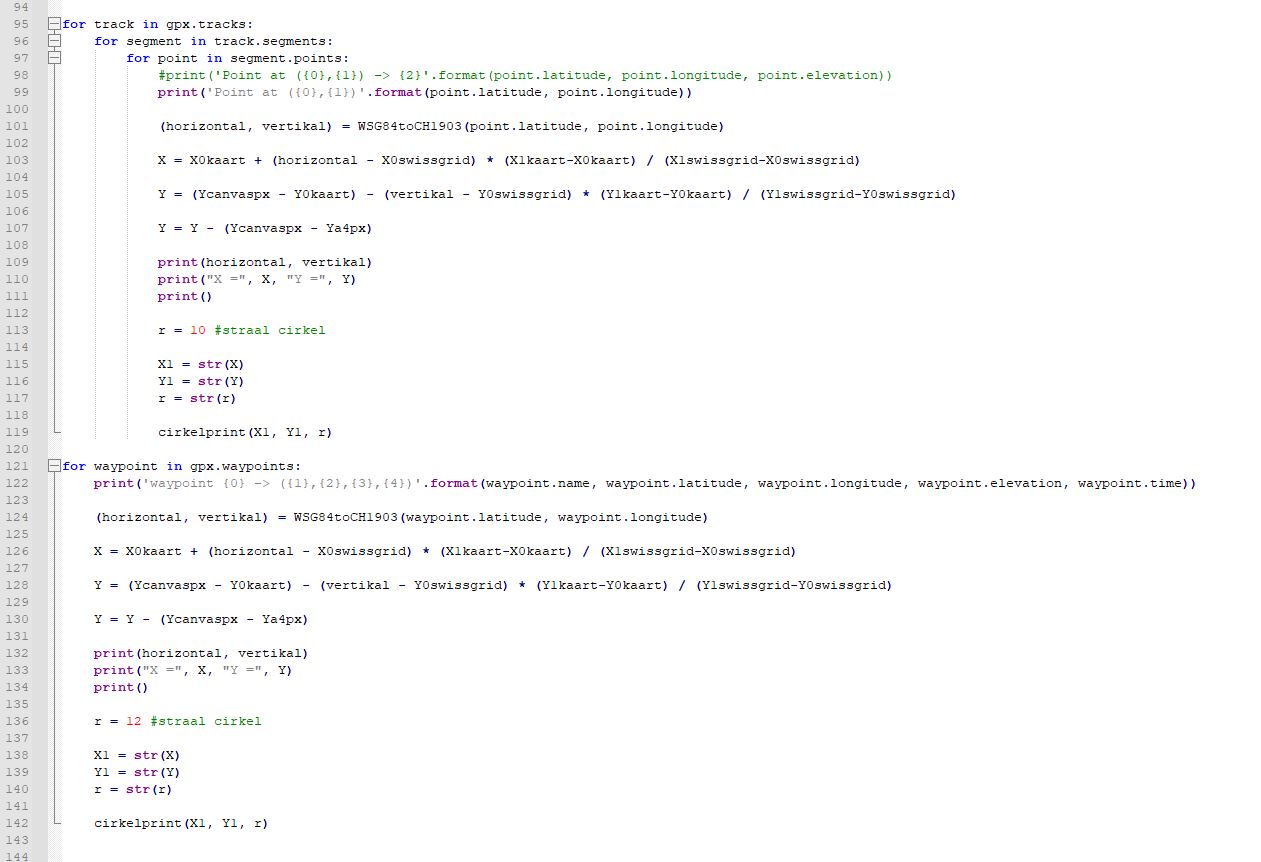
Calculation of the proper coordinates. First routine for trackpoints, second routine for waypoints.
Results X1, Y1 and r (radius of dot printed) are writen to SVG-file with funktion cirkelprint(X1, Y1, r).
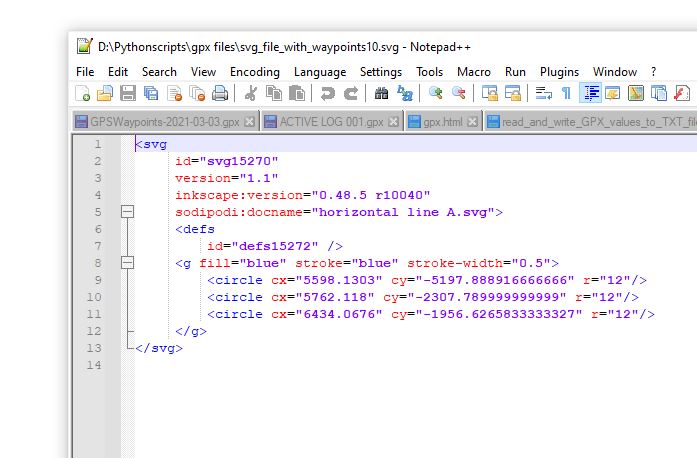
And this here below is the resulting SVG-file. The three relevant lines <circle cx=" ... etc.> can be copy pasted
directly into the XML of the SVG-file of the map or use Inkscape to import as a layer.