Import lines of equal altitude from SVG map into QGIS
Bas den Brok - mapping course
Understanding of python, SVG and some understanding of Dutch and QGIS required.
We want to import lines of equal altitude from an SVG map to QGIS. We want to use Python to parse the SVG file and make
a list of coordinates in txt format to import in QGIS.
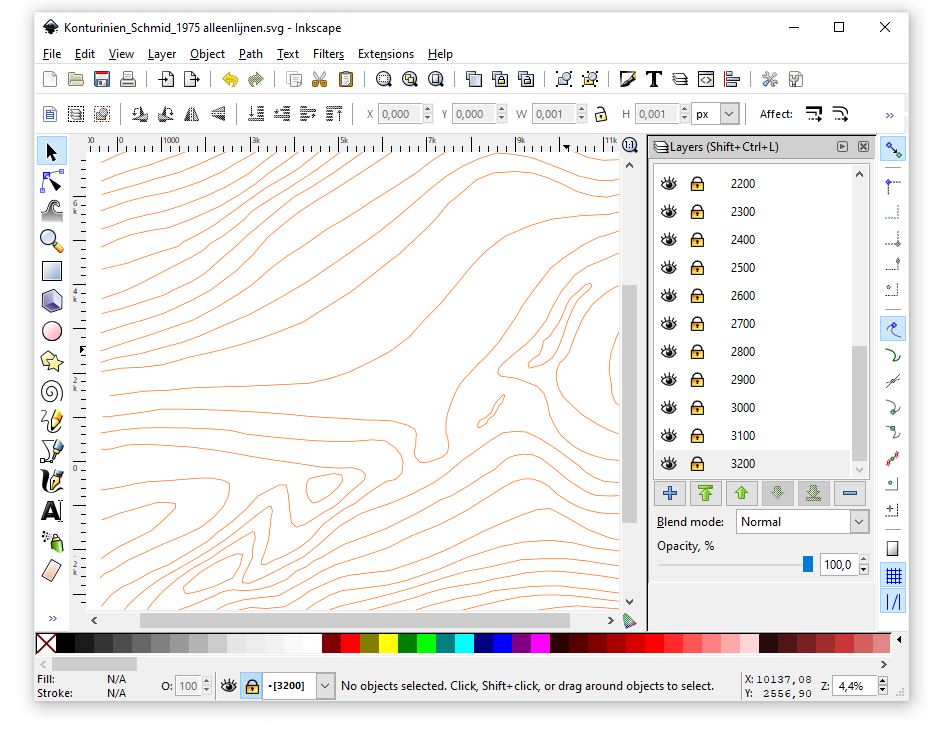
Here below is the SVG map with lines of equal altitude corresponding to the structure lines of the Glarus thrust
from the publication of Schmid (1975). Each altitude is in a separate layer with the altitude as name as you can see
in the window with the layers. Intervals of 100 m.
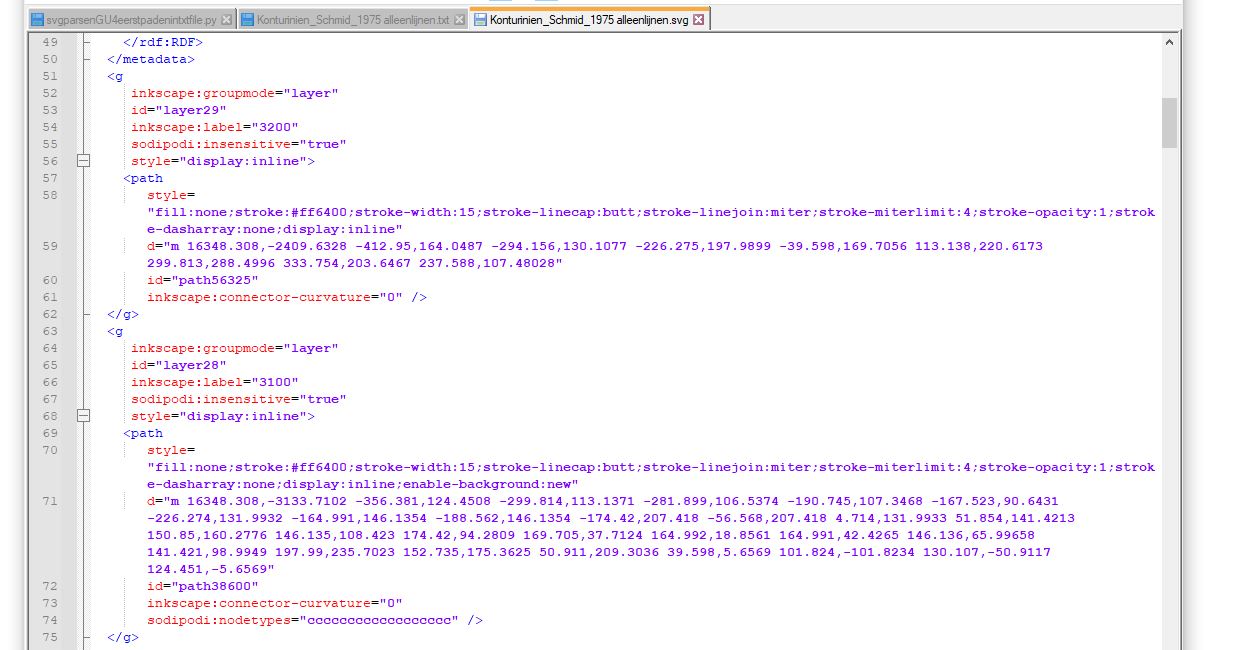
The SVG code looks as here below. You see on the image one path d="m 16348 etc. ... " (line 59) corresponding to the
isoline of 3200 m altitude (inkscape:label line 54) and one path d="m 16348 etc. ... " (line 71) corresponding to the isoline of 3100 m altitude (inkscape:label line 66)
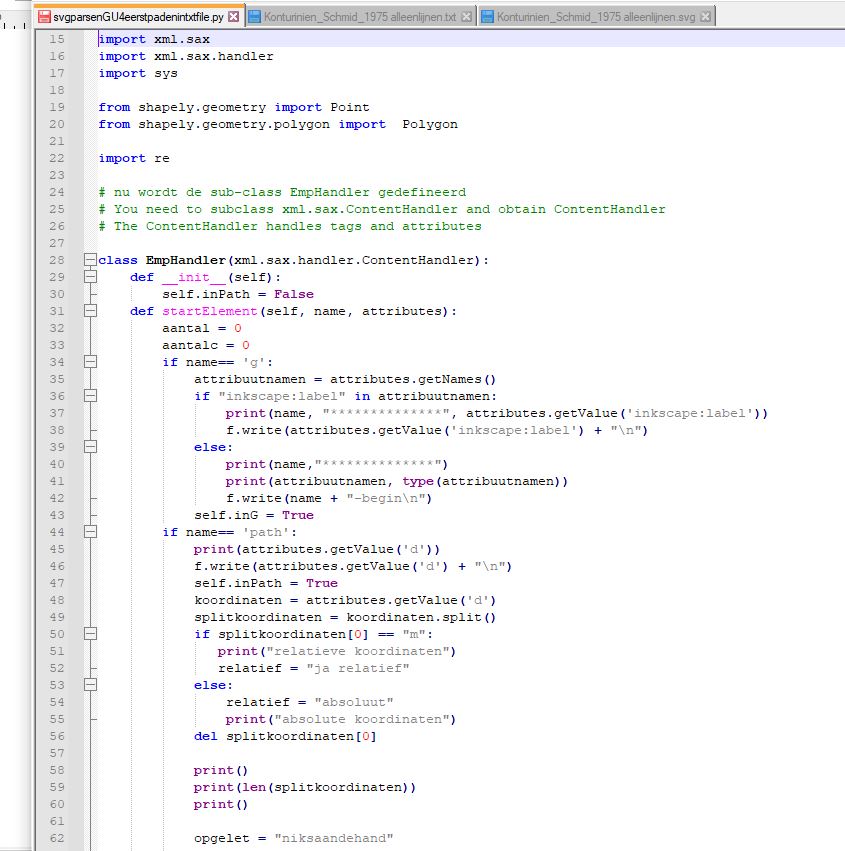
Here is the entire Python file: svgparsenGU4eerstpadenintxtfile.py (not for use! Only to help you write your own program.) You see the definitions needed to read the inkscape:label (lines 36-38)
and the d-attribute of the path (lines 44-56).
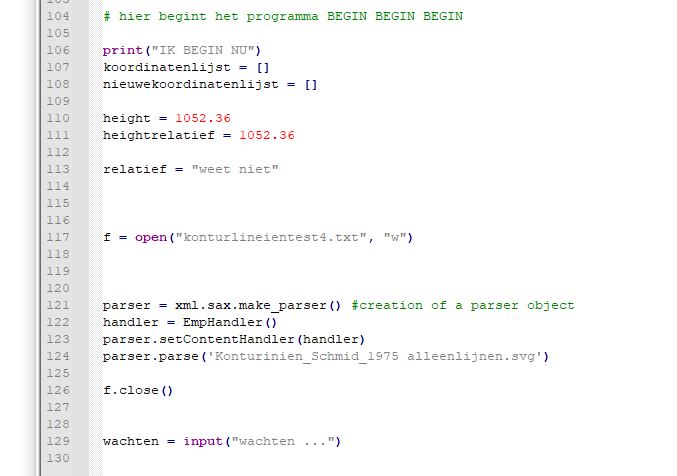
This here below is the program proper showing that the contents of the inkskape:label fiels (altitude) and of the
d-attribute of the path (the iso line) are written to the text file defined in line 117.
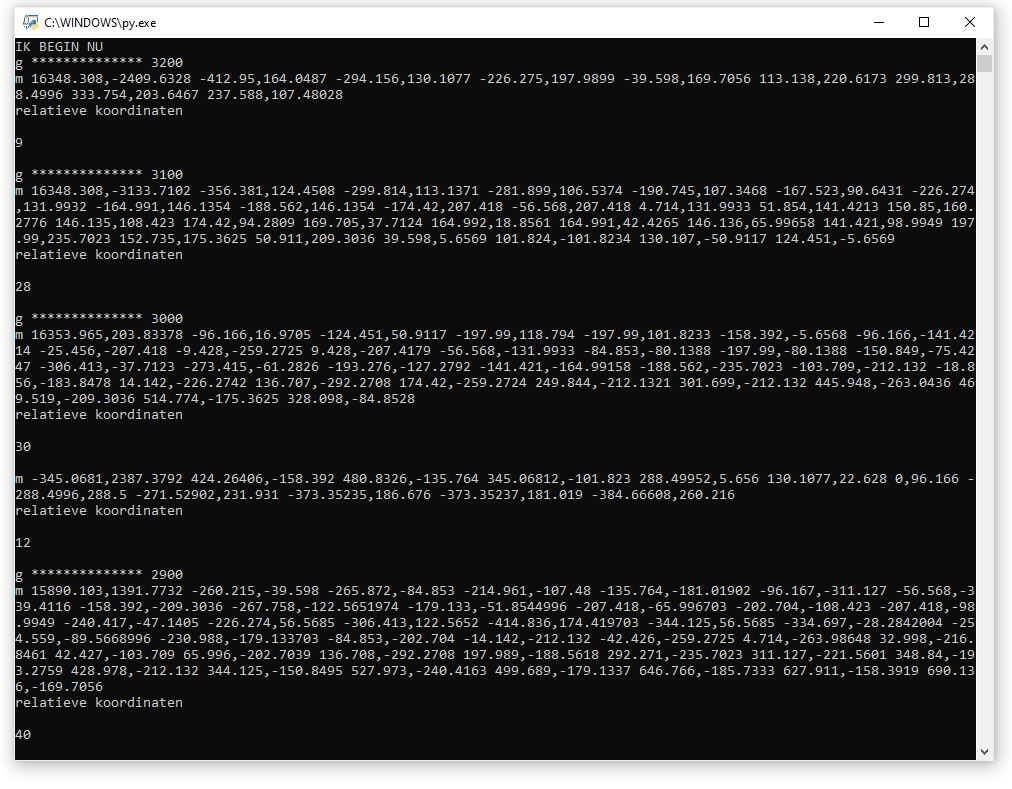
The screen output looks like this here below. You see that only altitude and the d-attribute of the path are shown.
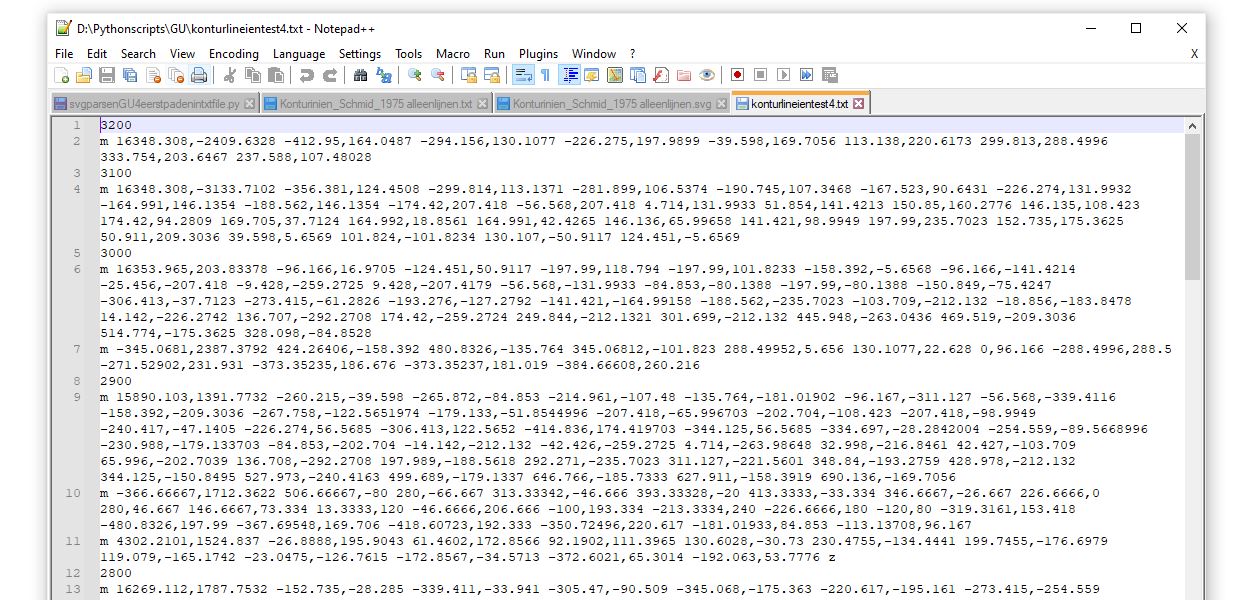
This is the text file that is stored.
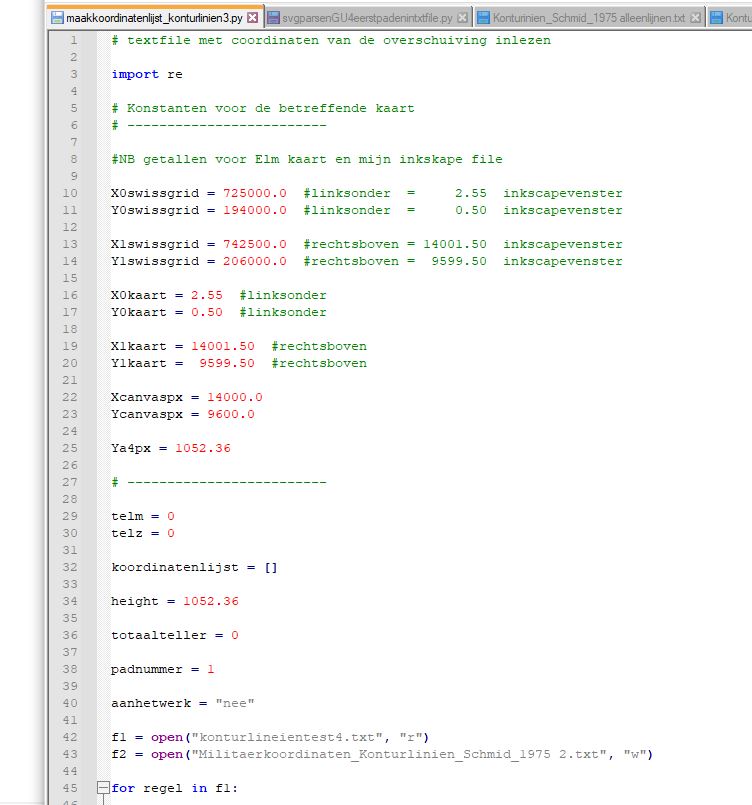
Now we need to convert the SVG-path to Swissgrid CH1903 coordinates. Here is the Python file to do that: maakkoordinatenlijst_konturlinien3.py (not for use! Only to help you write your own program.) Lines 10 to 25 are the values needed to convert the SVG coordinates to Swissgrid coordinates.
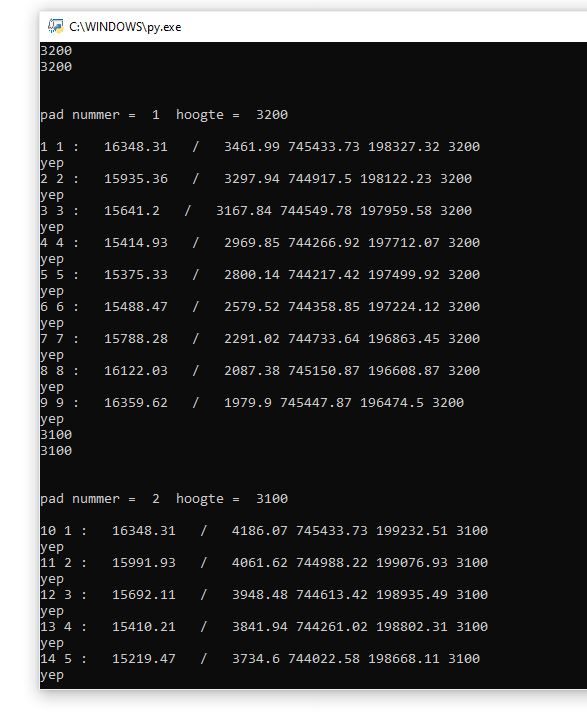
Screen output showing for the isoline of 3200 m altitude the coordinates of the nodes that built the line. They are
nine nodes and per node you see the SVG coordinates (X and Y) and the Swissgrid CH1903 coordinates (X and Y) and the elevation.
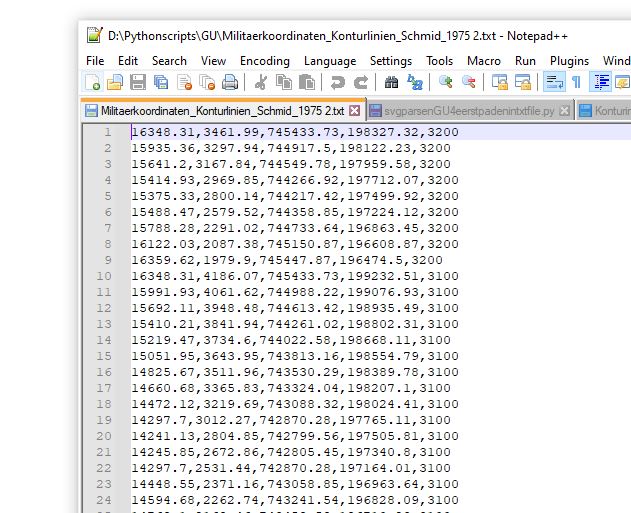
Below is the txt-file to which the data are stord. Again: SVG-coordinates (X and Y) and Swissgrid-CH1903-coordinates (X and Y) and the altitude.
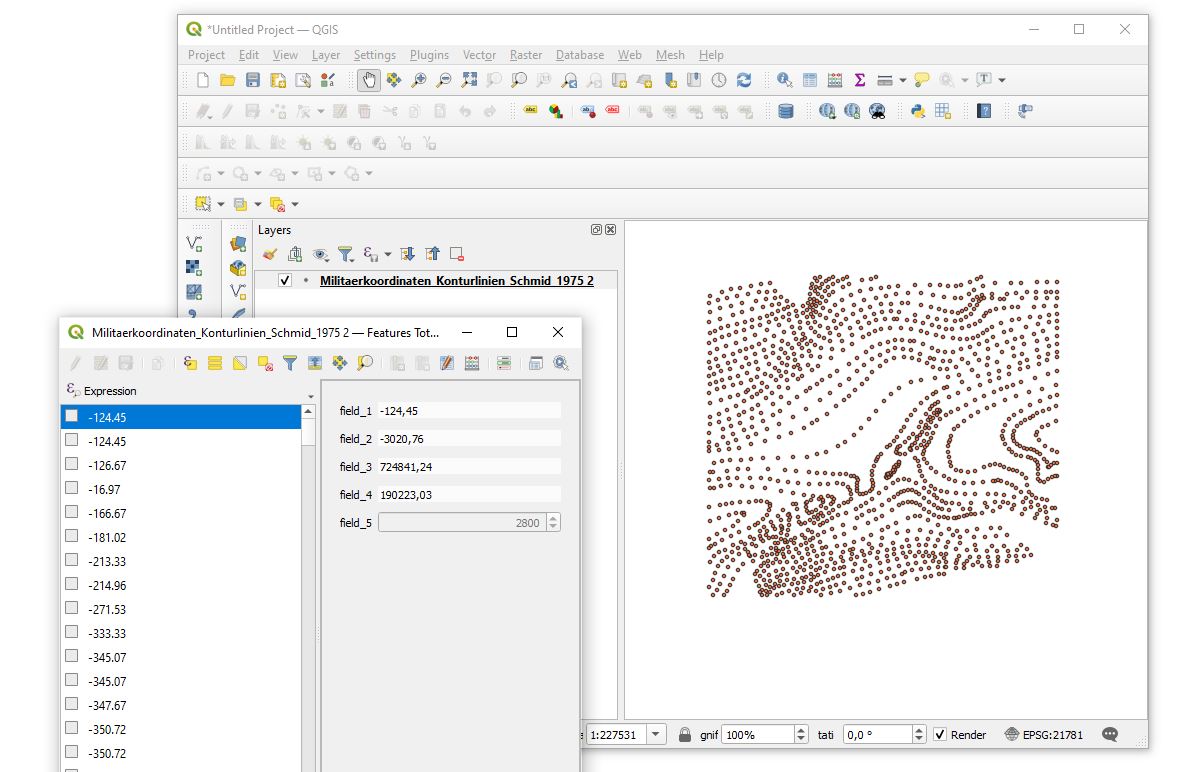
Below is the result as imported in QGIS.
Field 1 is SVG-X-coordinate, field 2 is SVG-Y-coordinate, field 3 is CH1903-X-coordinate, field 4 is CH1903-Y-coordinate
and field 5 is the elevation (in meter). SVG-coordinates are not used.