
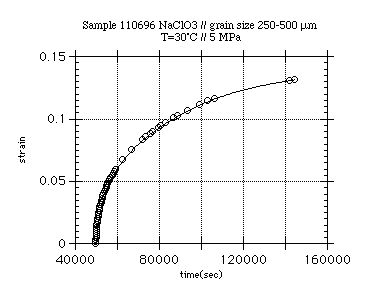
Figure 1. Typical strain versus time curve obtained from a
linear compaction experiment on sodium chlorate. The compaction rate
decreases with time as a consequence of densification of the aggregate.
Figure 2. Typical logarithmic strain rate versus logarithmic
strain curve obtained from the same linear compaction experiment on sodium
chlorate as in figure. 1. The compaction rate decreases with the strain
approximately following a power law with an exponent of about -2.

Figure 3. Effect of compaction rate on grain size displayed in
logarithmic strain rate versus logarithmic strain graphs of three
experiments on sodium chlorate with different grain sizes, but at
otherwise similar conditions. As a first approximation, at a strain of
0.1, the strain rate depends on the grain size to the power -3.
BACK
to the previous page
BACK to the Institut für Geowissenschaften in Mainz
BACK to the Geological Institute ETH Zürich